A CFO opens her weekly financial review and notices that the network’s denial rate has ticked up 0.8% compared to last quarter. This is a specific question she wants a specific answer to: why is denial rate up. In a dashboard-only world, her path to the answer looks like this. She opens the RCM dashboard, finds the denial rate metric, tries to drill into it, discovers the drill-down only breaks it out by month rather than by payer or reason code, closes the RCM dashboard, opens the operational analytics dashboard, tries to find a different denial view, cannot find one, emails the BI team, waits three days, receives a spreadsheet extract that answers the question at 40% precision, and eventually files a ticket to have a new dashboard view built. By the time the new dashboard exists, the market conditions that made the question urgent have shifted and she is asking a different question.
In a conversational reporting world, her path looks entirely different. She types ‘why is our denial rate up 0.8% this quarter’ into a chat interface connected to her data. Three seconds later she has an answer: 62% of the increase comes from Payer BC medical-necessity denials, up 3.1x since April 22. 28% comes from prior auth issues at the Riverside clinic. 10% from missing modifiers on E&M codes. She asks a follow-up: what changed with Payer BC. Answer: they updated medical-necessity criteria for imaging on April 15, effective April 22. $847K held in denials, 142 claims affected. She asks another follow-up: what should we do. The AI produces a specific set of actions. The entire investigation took her four minutes, produced better analysis than the ticket-based process would have, and ended in a decision she can act on the same day.
The gap between these two experiences is the story of conversational reporting in healthcare. Not because dashboards are bad — they are excellent at certain jobs — but because dashboards were designed to answer a fixed set of questions that someone anticipated in advance. Real operational questions are unpredictable, contextual, and often follow-up-driven. Answering them requires an interface that responds to the question the user has, not the questions the BI team could imagine last quarter. This article walks through why the shift to conversational reporting is happening, which use cases actually benefit, where dashboards still belong, and what has to be true underneath for conversational reporting to work reliably.
What Dashboards Do Well — and What They Cannot
Dashboards are excellent at three specific jobs. First, they are the right interface for monitoring known metrics — the KPIs a leader has decided matter and wants to see the current state of at a glance. Denial rate, days in AR, appointment fill rate, patient satisfaction score. These are the metrics you already know you want to track, and having them laid out in a familiar visual arrangement is exactly right. Second, dashboards are the right interface for routine reporting — the monthly board deck, the weekly operations review, the quarterly financial packet. These outputs benefit from consistency, and consistency is what dashboards deliver. Third, dashboards are the right interface for scanning — the ten seconds a busy leader has to skim a page and see if anything is off. Visual signals do that job well.
What dashboards cannot do — no matter how much investment goes into them — is answer questions the designer did not anticipate. The 40 pre-built views on your RCM dashboard cover 40 specific questions. Question 41, whatever it happens to be, requires either a filter combination that was not designed in, a drill path that does not exist, or a metric that is not on any dashboard. The user’s options are to route through the BI team (slow), to build their own view (technical), or to ask the question out loud in a meeting and hope someone can answer (unreliable). This is where dashboards structurally fail, and it is exactly the case that conversational reporting exists to serve.
What Conversational Reporting Actually Is
Conversational reporting is not a chatbot for dashboards. It is not a natural-language front-end to your existing BI tool. Both of those are marketed as conversational reporting and neither of them delivers the value that real conversational reporting can. What conversational reporting actually is: an interface where a business user can ask a question in plain language, and the system translates that question into the specific queries needed against your data, executes those queries, interprets the results in context, and returns an answer that includes both the numeric findings and the narrative explanation. Follow-up questions maintain context — the system remembers what you were just asking about and lets you refine or drill without repeating yourself.
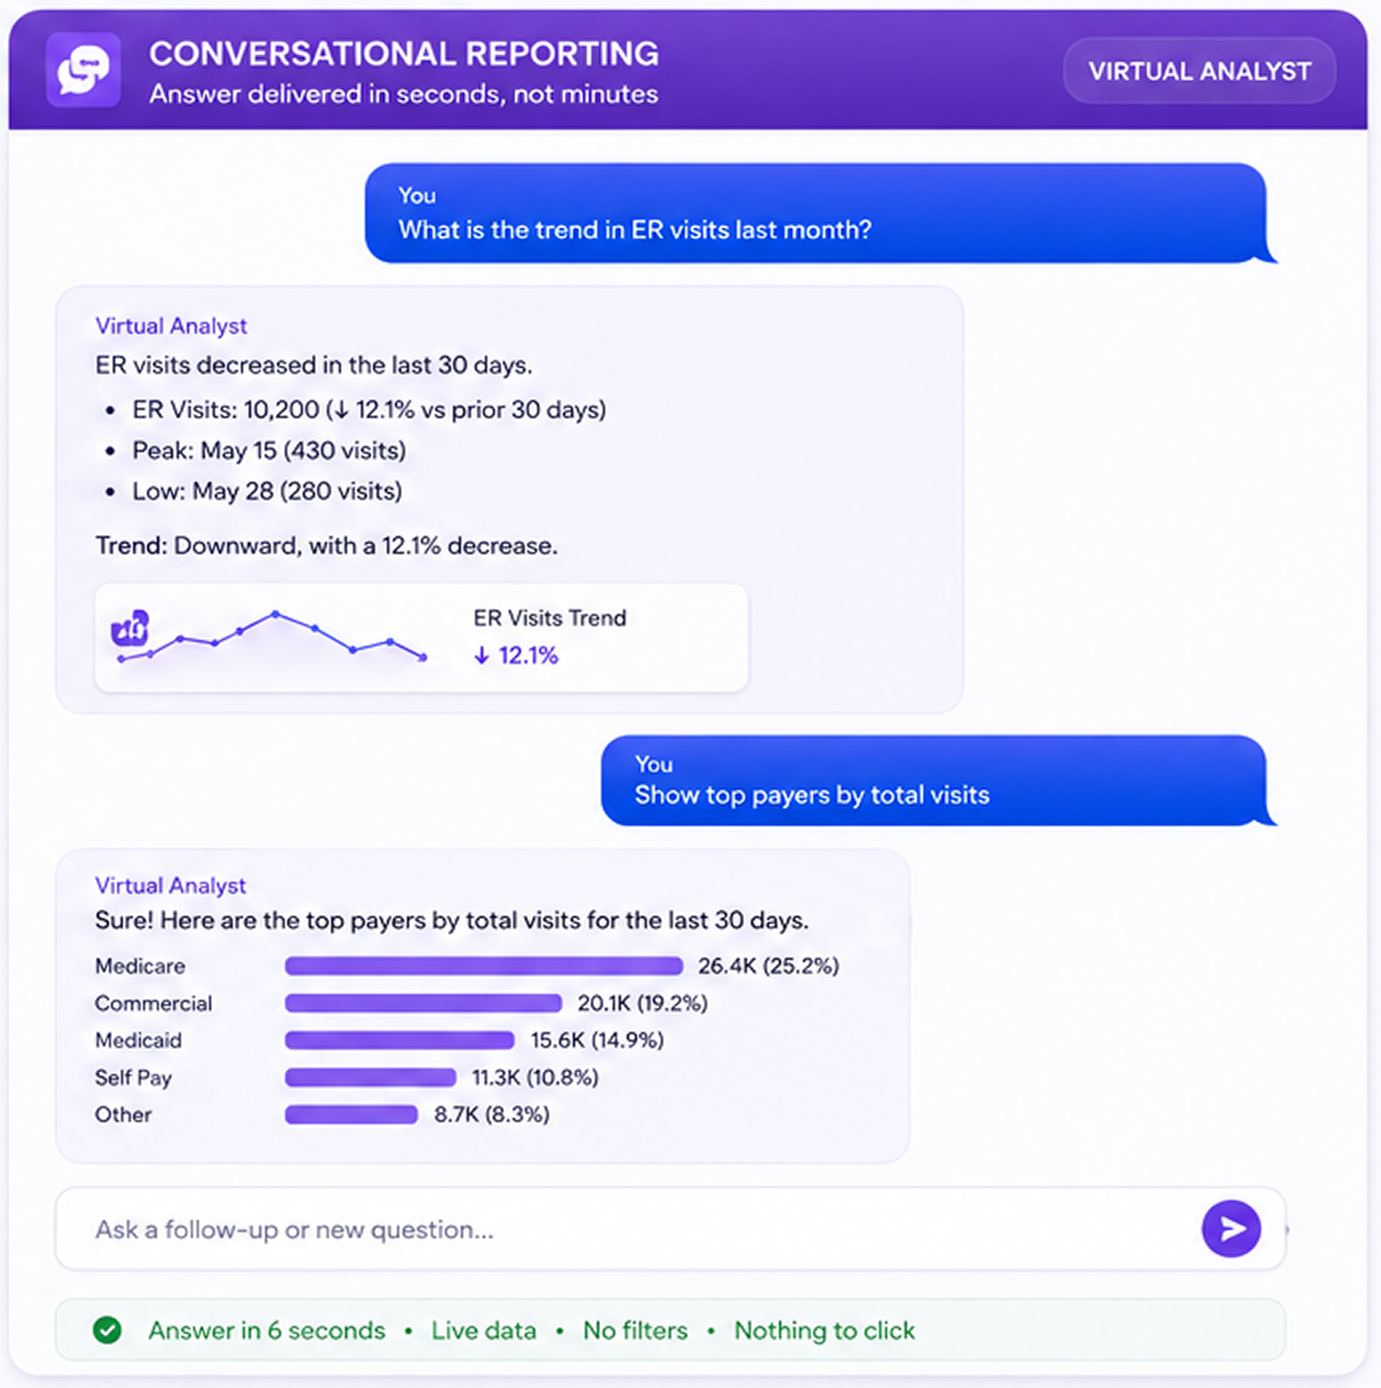
This capability requires four things underneath. It requires a unified data foundation where the data actually exists in a queryable form across the systems you care about — not scattered in silos that the AI cannot reach. It requires a semantic layer that maps business terms to database structures — knowing that when the CFO says ‘denial rate’ she means a specific formula against specific tables. It requires a large language model capable of translating natural language into structured queries and translating query results back into natural language explanations. And it requires a governance layer that ensures the AI only surfaces data the user is authorized to see and only executes queries that are safe against your data. Without any one of these four, conversational reporting produces confident-looking answers that are subtly wrong — which is worse than not answering at all.
Why It Wins for Most Users, Most of the Time
Conversational reporting wins for most healthcare users for a specific reason: most healthcare users are not analysts. A physician wants to know how many of her diabetic patients have not been in for a hemoglobin A1c check in the last six months. A department chair wants to know which of his providers have the highest patient satisfaction scores and what the pattern is. A clinic manager wants to know why last Tuesday’s schedule ran 40 minutes behind. None of these users wants to build a dashboard view, apply filters, or wait for a BI ticket. They want an answer. Conversational reporting gives them that answer in seconds, in language they can act on, without requiring them to know how the data is organized underneath.
The productivity implications compound. When answering a question drops from days to seconds, people ask more questions. When they ask more questions, they make more informed decisions. When they make more informed decisions, the operation runs better. The organizations that have deployed conversational reporting well report a specific cultural shift: leaders and frontline staff start asking data questions they would not have bothered to ask before, because the friction is gone. That behavioral shift is worth more than the specific answers to any individual question, because it changes how the entire organization uses information to run itself.
Where Dashboards Still Belong
The right way to think about the shift is not conversational reporting replacing dashboards, but each interface being used for what it does best. Dashboards belong for standing metrics that leaders scan repeatedly. Dashboards belong for regulatory and board reporting where consistency matters. Dashboards belong for operational monitoring where visual pattern recognition is faster than reading text. Dashboards belong for any use case where the question is well-known and the answer needs to be at a glance. Conversational reporting belongs for ad-hoc investigation, exploratory analysis, drill-through of unusual metrics, cross-system questions, and any scenario where the question is contextual and cannot have been pre-anticipated.
In practice, this means most healthcare organizations end up with both interfaces on top of the same data foundation. Standing metrics live in dashboards; investigation happens in conversation. The user chooses the interface based on the task, not the tool. What changes is the ratio: whereas previously 100% of reporting had to fit into dashboards because no other interface existed, now maybe 30% of it goes through dashboards and 70% happens through conversation. The 30% is still important — those are the metrics leaders look at every day — but the 70% represents genuinely new capability rather than an incremental improvement over prior tooling.
Where Conversational Reporting Fails
Not every deployment of conversational reporting succeeds. The failure modes are consistent and worth naming. The first is silent inaccuracy — the AI produces an answer that looks credible but is subtly wrong because the underlying query it generated missed a nuance in the data model. A CFO asking about ‘denials’ gets a number that excludes technical denials because the model interpreted ‘denials’ as clinical denials only. The answer looks confident. The decision made from it is wrong. This failure mode is prevented only by rigorous semantic layer design and by validation processes that catch these interpretations before they reach users. Organizations that skip this work discover the problem when a leader makes a public decision based on an AI answer that turns out to be incomplete.
The second failure mode is scope drift. Users start asking questions the system was not designed to handle — cross-system questions when only one system is connected, forward-looking questions when the data is only historical, questions that require reasoning the model cannot do. Instead of refusing gracefully, poorly designed systems answer anyway, generating plausible-looking output that is not grounded in actual data. Well-designed systems explicitly acknowledge scope — ‘I do not have visibility into the credentialing data required to answer that’ — and route to a human or a different tool. The discipline of graceful refusal is rarer than it should be and is what separates enterprise-grade conversational reporting from consumer-grade demos.
The third failure mode is trust collapse after a bad answer. Conversational reporting is a trust-based interface: users ask questions because they trust the answers. One high-visibility wrong answer to a senior leader can undo months of adoption progress, because the leader tells other leaders and the story spreads faster than any counter-evidence. Organizations that succeed with conversational reporting invest heavily in getting the first six months of production accuracy exceptionally high, even at the cost of scope. Better to answer 20 questions perfectly than to answer 200 questions with 90% accuracy. Once trust is established, scope can expand. Once trust is broken, the program often does not recover.
What Has to Be True Underneath
The biggest mistake organizations make with conversational reporting is buying the interface and pointing it at their existing fragmented data. This never works. Conversational reporting is only as good as the data foundation beneath it. If the CFO asks ‘why are denials up’ and the system only has access to the billing system’s denial data, it will give an answer that misses the clinical documentation context or the payer policy context that actually explains the increase. If the physician asks about her diabetic patients and the system only sees the EHR structured fields, it will miss the patients whose diabetes is documented in narrative text but not coded. Conversational reporting inherits all of the limitations of its underlying data — which is why organizations that succeed with it invariably invest in an integration layer or operational intelligence hub first, and then add conversational reporting on top of the unified data foundation that layer provides. The dashboard-only shortcut is genuinely a shortcut: skip the data unification work and the conversational interface will be a demo forever. The organizations that get this right treat the conversational interface as the last step in a longer journey, not the first. They build the data foundation, they establish the semantic layer, they configure governance, and only then do they add the natural-language front door. The result is a capability that transforms how the organization uses its own data — turning what used to be a specialized analyst function into an everyday tool available to every leader who has a question worth asking.
About BTCNXT
BTCNXT builds conversational reporting solutions on unified healthcare data foundations. From semantic layer design to governance and natural language interfaces, we help healthcare organizations turn data investigation from a multi-day analyst process into a multi-second conversation any leader can have.